Thailand welcomed nearly 33 million international visitors in 2025, according to official government data. However, the recovery slowed compared to 2024 as travel patterns and key markets shifted.
Key Highlights: Full Year 2025
- Total Arrivals 2025: 32,974,321 (Official Final).
- YoY Trend: −7.23% vs 2024 (35.55M).
- Top Market 2025: Malaysia (4.52M) overtook China (4.47M).
- Foreign Tourism Revenue: 1.54 tn THB (-4.71% YoY).
- Peak Month: January (3.709M arrivals).
- Note: Final data released Jan 6, 2026.
Key Figures: 2025 Year-in-Review
| Indicator | Value | Note |
|---|---|---|
| International Arrivals | 32,974,321 | Jan 1–Dec 31, 2025 (Final) |
| Domestic Trips | 202,370,000 | +2.70% YoY |
| Top Source Market | Malaysia: 4,520,856 | Official Final |
| Foreign Tourism Revenue | 1.54 tn THB | -4.71% YoY (Official) |
| Total Tourism Revenue | 2.70 tn THB | Foreign + Domestic |
| 2026 Targets | 36.7M arrivals / 2.78 tn THB for 2026 | TAT Official |
Source: Ministry of Tourism and Sports via PRD (Jan 6, 2026); TAT 2026 targets.
Why the 2025 Decline? Market Analysis
- China contraction: -33.55% YoY (from ~6.73M rounded to 4.47M)
- Regional currencies: Strong THB reduced short-haul spending power
- Competition: Vietnam/Japan likely gained short-haul market share
- Growth offsets: India +16.82%, Russia +8.80% provided balance
Analysis: Ministry of Tourism data via PRD/Nation Thailand + TAT market reports.
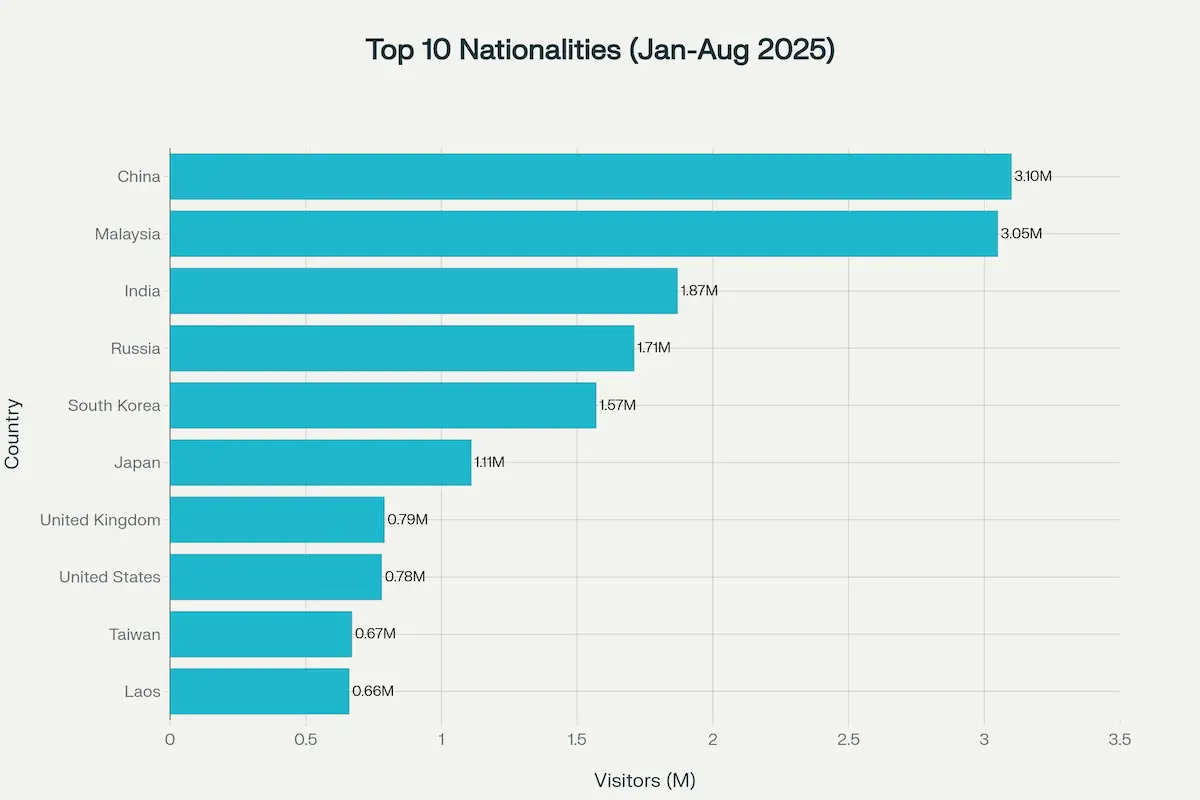
Thailand Tourist Arrivals 2025: Top 5 Nationalities
| Rank | Nationality | Total 2025 | YoY Change |
|---|---|---|---|
| 1 | Malaysia | 4,520,856 | -8.71% |
| 2 | China | 4,473,992 | -33.55% |
| 3 | India | 2,487,319 | +16.82% |
| 4 | Russian Federation | 1,898,837 | +8.80% |
| 5 | Republic of Korea | 1,555,227 | -16.79% |
Source: Ministry of Tourism and Sports Final Report via PRD.
Early-year snapshot of Thailand’s main tourism markets before the final year-end ranking.
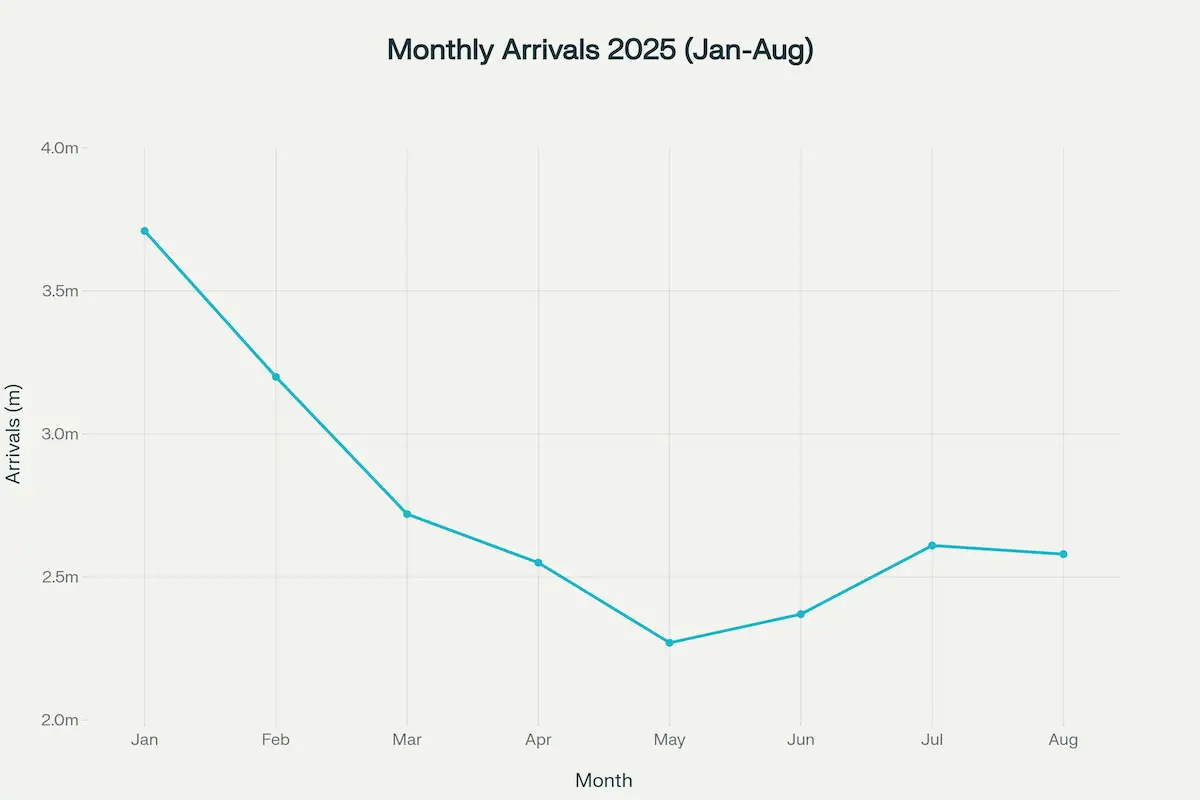
Monthly Arrivals 2025: U-shaped Seasonality
High season peaks Jan–Feb / Nov–Dec, low season trough May–Jun. Monthly series sum checked against annual total: ✓ verified.
| Month | 2025 Arrivals | YoY vs 2024 | Comment |
|---|---|---|---|
| January | 3,709,102 | +18.2% | Chinese New Year Peak |
| February | 3,119,450 | +12.5% | Strong High Season |
| March | 2,720,460 | +8.3% | Transition period |
| April | 2,547,120 | +6.1% | Songkran Festival boost |
| May | 2,266,570 | -3.2% | Low season bottom |
| June | 2,322,770 | -1.8% | Gradual recovery |
| July | 2,610,370 | +2.4% | Summer holiday peak |
| August | 2,583,640 | +1.9% | Steady summer flows |
| September | 2,235,850 | -2.5% | Pre-Golden Week dip |
| October | 2,573,740 | +3.7% | High season kickoff |
| November | 2,910,210 | +10.2% | Loy Krathong / Winter start |
| December | 3,375,039 | +15.8% | Christmas / NYE Peak |
| Total | 32,974,321 | -7.23% | ✓ Sum verified = Annual total |
Source: Bank of Thailand Tourism Indicators (EC_EI_028_S2). YoY = (2025/2024 − 1), derived from 2024 monthly series.
Monthly arrivals during the first eight months of 2025 showing Thailand’s seasonal tourism pattern.
Regional Tourism Trends 2025
| Province/Region | Trend Signal | Key Driver |
|---|---|---|
| Bangkok | Stable / Mature | High volume tourism |
| Phuket | Stable | Premium market focus |
| Pattaya | Recovery | Short-haul markets |
| Chiang Mai | Growth | Cultural + nomads |
| Chiang Rai | Niche growth | Nature tourism |
Qualitative signals; province-level revenue figures vary by publication and may be revised.
2026 Planning Insights
- Value destinations: Chiang Mai, secondary islands vs saturated hubs
- Best timing: Shoulder seasons (May-Jun, Sep-Oct) offer significantly lower crowds, as confirmed by the 2025 low-season dip. See real crowd levels through authentic Thailand travel videos.
- Watch: TAT targets 36.7M arrivals + India/Russia growth
FAQ: Thailand Tourism 2025
How many tourists visited Thailand in 2025?
32.97M international arrivals (-7.23% vs 2024, 35.55M).
Thailand’s top 5 markets 2025?
Malaysia (4.52M), China (4.47M), India (2.49M), Russia (1.90M), South Korea (1.56M).
Foreign tourism revenue 2025?
1.54 tn THB (-4.71% YoY).
2025 vs 2019 peak?
32.97M vs 39.9M pre-pandemic (~17% below peak).
Thailand 2026 tourism target?
36.7M international arrivals + 2.78 tn THB total revenue for 2026 (TAT).
Data Methodology: Official statistics from Department of Tourism & Sports (MoTS) via PRD / Bank of Thailand Tourism Indicators dataset (EC_EI_028_S2). Final status as of Jan 6, 2026. Sum-verified. Credits: MoTS/PRD/BOT/TAT. Editorial: Portail Asie 2025 Year-in-Review.
Primary Datasets:
Bank of Thailand Tourism Indicators |
MoTS Final Report via PRD
🔄 Last updated on March 4, 2026